

Bond Yield Curve Explained A Practical Guide for Investors
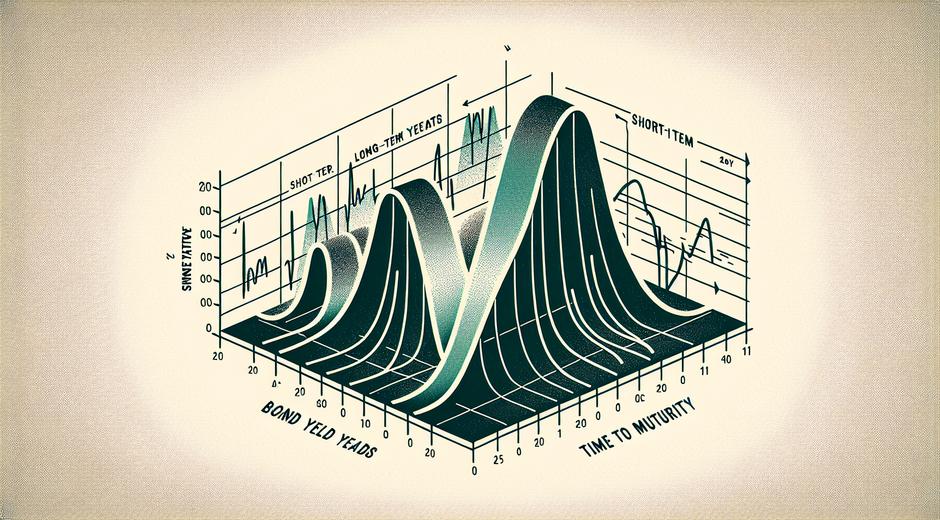
The Bond Yield Curve is one of the most important charts in finance It provides a visual snapshot of the relationship between yields and maturities for bonds issued by a given borrower Most often analysts look at the curve for government debt because it is treated as the benchmark for risk free rates Understanding the Bond Yield Curve helps investors forecast economic direction manage risk and build smarter fixed income portfolios
What is the Bond Yield Curve
The Bond Yield Curve is a line that traces the yields of bonds of identical credit quality across different maturities The typical plot displays the yield on the vertical axis and time to maturity on the horizontal axis The shape of this curve can change over time and those changes carry meaning for investors policy makers and corporate treasurers
When the curve slopes up it implies that longer dated bonds offer higher yields than near dated bonds That pattern compensates investors for greater interest rate risk and for uncertainty about future inflation When the curve is flat yields are close across maturities When the curve slopes down or inverts shorter dated yields are higher than longer dated yields and that pattern has often preceded economic slowdowns
Common Shapes and What They Mean
There are three common shapes and each carries a different message
Upward sloping or Normal Curve This reflects healthy economic expansion Investors demand higher yield for holding longer dated bonds due to uncertainty over time
Flat Curve This suggests that investors expect slower growth or transitory risk factors and it can be a transition stage to inversion
Inverted Curve This has historically signaled a high probability of future recession An inversion means short term yields exceed long term yields and that implies market participants expect lower rates in the future driven by weaker growth or falling inflation
Why the Bond Yield Curve Changes
Several forces move the Bond Yield Curve simultaneously Investors expectations for growth and inflation central bank policy and global capital flows all influence yields at different maturities For example when central banks raise policy rates they most directly affect short term rates
Longer term yields respond more to expected path of inflation and to the term premium Term premium is compensation for holding a long dated bond rather than a series of short dated instruments It reflects uncertainty about future rates and risk preferences When uncertainty rises term premium can widen pushing up long term yields even if growth expectations fall
Yield Curve as a Recession Indicator
Market participants and academics pay close attention to the Bond Yield Curve as a leading indicator of recession Historically an inversion of the curve preceded many recessions in advanced economies The logic is simple When investors expect a slowdown they price in lower future short term rates and seek the safety of long dated government debt That activity pushes up short term yields relative to long term yields causing inversion
Timing can vary and inversion does not cause a recession It is a symptom of underlying market expectations But the consistency of this signal over multiple cycles has made the yield curve a valuable tool for risk assessment and scenario planning
How to Read the Curve for Portfolio Decisions
For investors reading the Bond Yield Curve can inform allocation and duration choices
If the curve is steep investors may favor extending duration to lock in higher long term yields If the curve is flat or inverted investors may prefer shorter duration to reduce vulnerability to a rise in yields or to avoid locking in low long term yields
Credit investors also monitor the curve to price spread over government yields The spread is the additional yield that compensates for credit risk When spreads widen relative to the curve it can signal rising perceived credit risk or lower liquidity
Impact on Other Markets
The Bond Yield Curve influences mortgage rates corporate borrowing costs and the valuation of equities Higher long term yields can increase discount rates used in equity valuation reducing present value of future earnings That in turn can pressure stock prices especially for companies with earnings far in the future Growth oriented firms are more sensitive to such moves
Mortgage lenders use longer dated yields as a reference for home loan pricing so changes in the curve can rapidly alter affordability in the housing market A steep curve tends to widen the gap between short term policy rates and long term mortgage rates which can be favorable for bank net interest margins
Practical Tools for Monitoring the Curve
To make informed decisions investors should track multiple indicators alongside the Bond Yield Curve Real time yield data term premium estimates inflation break even rates and central bank communications are all important Combining these data points yields a more robust view than relying on the curve alone
Research platforms and financial news services provide historical curve charts and yield time series For a broad range of commentary and resources visit financeworldhub.com where readers can find deeper analysis tailored to different investor profiles
Strategies Around Curve Changes
There is no one size that fits all but investors often adopt one of several strategies
Carry Approach When the curve is steep investors may extend duration to capture higher carry But they must manage interest rate risk and be ready for volatility
Defensive Stance If the curve inverts investors may shorten duration increase cash holdings or shift into high quality short dated instruments to protect capital
Curve Trading More active traders implement relative value strategies They may take offsetting positions across maturities to profit from expected changes in slope or curvature Such trades require precise execution and risk controls
Limitations and Risks
The Bond Yield Curve is a powerful tool but it has limits It reflects aggregated market expectations which can be distorted by large scale central bank asset purchases or regulatory shifts Global demand for safe assets can flatten the curve even when fundamentals remain healthy Also technical factors in markets can create noise
Investors should avoid over relying on any single signal Use the curve as part of a broader toolkit that includes credit analysis macro indicators and liquidity assessment
Where to Get Reliable Data
Quality sources for historical and current yield curve data include official government debt sites central bank releases and specialized data vendors For broad historical archives and newspapers covering market moves try services that aggregate content and rates For a useful source of archived market commentary and rate tables see Newspapersio.com which can help reconstruct past market environments for scenario analysis
Conclusion Practical Takeaways
The Bond Yield Curve remains a central analytical tool for investors lenders and policy makers Its shape encapsulates market expectations about growth inflation and policy action and it helps guide duration and credit decisions While an inverted curve has been a reliable warning of past recessions it is not a precise timer and must be used alongside other indicators
For long term investors the key is to integrate yield curve analysis into a disciplined process that balances return objectives with risk capacity Regular monitoring scenario planning and stress testing will help translate curve signals into actionable portfolio adjustments
If you want to deepen your understanding of the Bond Yield Curve and how to apply it to asset allocation explore more guides and model cases at our site